What are VC-Curves, why are they useful, and how are they relevant?
Vibration Criteria Curves, or VC-Curves, are a standard way to report vibration. They are helpful because they allow users to compare vibration levels across locations using a standardized, widely accepted format. However, electron microscopes, high-tech manufacturing tools, and vibration-sensitive equipment often have different specifications from the VC Curves. Therefore, it is helpful to have an expert collect and report the data for these cases to determine if a particular location will work for your unique requirements and compare data across sites using a standardized methodology.
VC Curves are a standard way to report vibration
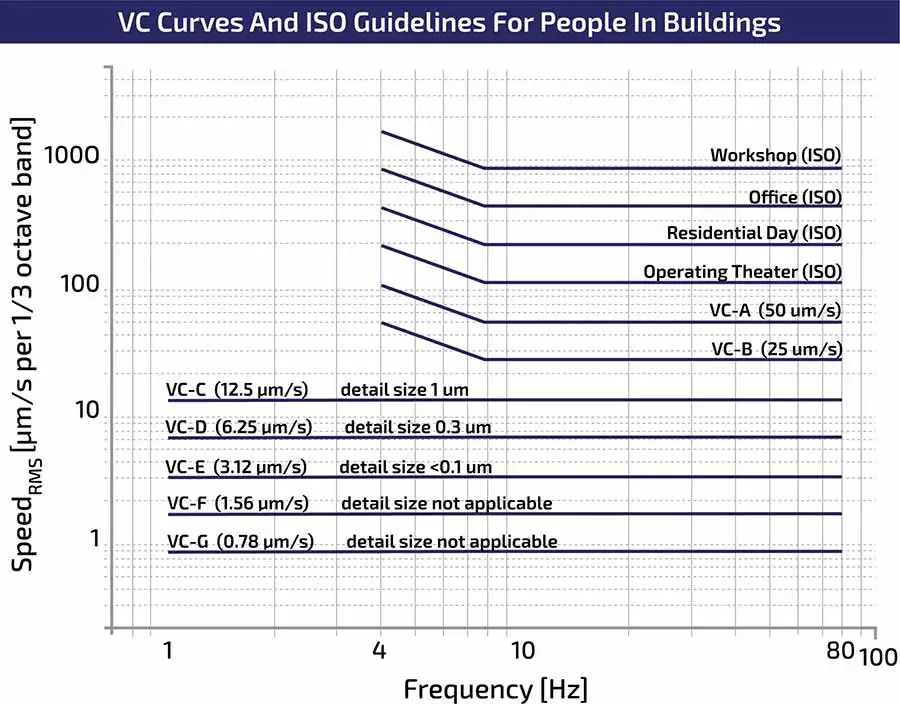
Engineers developed VC Curves in the early 80s to provide a standard when reporting vibration levels. VC Curves use a unit of meters per second (RMS) and display the data using ⅓ octave filtering. Without getting too much into the mathematical detail about why engineers selected this methodology, using meters per second allows for higher energy vibration at lower frequencies to account for a higher VC rating than lower energy vibration at higher frequencies. Using 1/3 octave filters bins vibration sources at similar frequencies together, which is useful when assessing the impact on resonances within structures and systems.
The engineers who developed VC curves labeled them alphabetically, with VC-G typically indicating the lowest level of vibration and VC-A the highest. Some report VC-Curves with higher vibration levels than VC-A, such as ISO Workshop, or lower than VC-G, such as VC-L, but typically VC-A to VC-G is the standard range. By reporting vibration levels using the VC Curves, decision-makers can quickly determine which location has higher or lower vibration levels than others.
Before the VC Curves, it was very challenging to compare vibration measurements
Before the VC Curves, it was challenging to compare vibration measurements because of the many permutations of units, filtering, and scaling. For example:
Types of motion. Acceleration, velocity, or displacement.
Different units. Engineers can report acceleration in gravity units, meters per second squared, inches per second squared, etc., while displacement can be inches, meters, micrometers, etc.
Different scaling. The data can be scaled using Peak to Peak, Zero to Peak, Power Spectral Density, etc.
Filtering. Engineers can filter the data using octave bands or narrow bands.
Unless engineers compare data using the same type of motion, the same units, the same scaling, with the same filtering, it is almost impossible without significant analysis to compare two data sets and determine which vibration level is higher at which location.
Who uses VC Curves
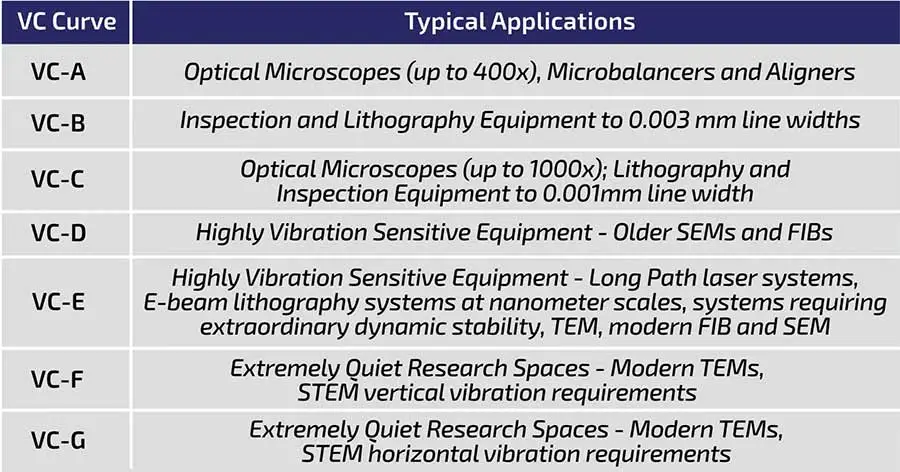
Typically, architects and facilities managers use VC Curves to generically describe the requirements of a building or describe the vibration levels in their facility. For instance, many architects will have a design requirement of VC-E or something similar for a research laboratory. They will then know that they probably need to have the location on the ground floor or slab on grade. There can not be any significant vibration sources nearby, such as an air handling unit or large compressor. If they are nearby, they need to be isolated. However, if the customer plans to use a lower resolution optical microscope, VC-A is probably acceptable, and the requirements will be less strict. Perhaps the second floor of a building would be appropriate. VC-Curves can provide guidelines for what type of equipment will work in different spaces.